
Table of contents
Introduction
When you're assessing an InSAR analysis of slope stability or ground subsidence how do you determine if the analysis is reliable?
One metric to look at is the Amplitude Dispersion Index (ADI).
In this article, we explain Amplitude Dispersion Index (ADI) and give a detailed walkthrough of how we look at estimating errors here at KorrAI.
This article is Part 4 of our Guide to InSAR Series intended for geotechnical engineers, risk analysts, safety engineers, and stakeholders involved in projects where ground subsidence risk management is a critical factor.
You can find all the articles of the series here:
- Basics of InSAR
- InSAR Processing
- InSAR Calibration using GNSS
What is the Amplitude Dispersion Index (ADI)?
To understand ADI, you’ll first need to understand two key concepts that underpin its use: Persistent Scatterers (PS) and UrbanSAR.
What are Persistent Scatterers?
Persistent Scatterers are stable, reflective features on the Earth's surface that return consistent radar backscatter over long periods. Common examples include building rooftops, exposed rocks, or other human-made structures. These are the backbone of Persistent Scatterer Interferometry (PSI) because their consistency makes them ideal for detecting subtle ground movements with high accuracy.
What is UrbanSAR?
UrbanSAR is KorrAI's proprietary InSAR technique - an advanced, cloud-scalable version of Persistent Scatterer Interferometry (PSI), designed specifically for monitoring ground deformation in urban environments.
Traditional PSI techniques use radar satellite images to detect tiny, slow ground movements—such as sinking land or shifting buildings—by analyzing reflections from stable objects over time. UrbanSAR builds on this by introducing a modular and cloud-native architecture, making it faster, more flexible, and highly scalable for large cities or infrastructure networks.
With UrbanSAR, users can:
- Efficiently process vast amounts of satellite radar data in the cloud
- Easily plug in new data sources (SAOCOM, TerraSAR-X, RCM etc) thanks to its modular design
- Monitor infrastructure and urban land with millimeter precision
Amplitude Dispersion Index (ADI) Explained
The Amplitude Dispersion Index (ADI) in the InSAR technique of UrbanSAR is a metric used to assess the quality and reliability of Persistent Scatterer (PS) points. PS points are stable radar targets on the Earth's surface, such as buildings or rocks, that exhibit consistent radar backscatter over time.
ADI measures the variability of the amplitude of radar signals returned from these PS points across the entire SAR time series. A low ADI suggests stable and reliable radar targets, making them ideal for precise deformation monitoring using PSI (Persistent Scatterer Interferometry) techniques. Conversely, a high ADI indicates significant variability in amplitude, often due to surface changes, atmospheric effects, or noise.
Why is ADI Important?
Identifying Reliable Monitoring Points
Not all surfaces reflect radar signals consistently. ADI filters out unreliable scatterers such as vegetation or water bodies, and helps select points with strong and consistent reflections.
Enhancing Deformation Accuracy
Radar points with high ADI contribute more noise than signal. By thresholding based on ADI, our analysis improves the signal-to-noise ratio of the final deformation maps.
Validating with Ground Sensors
We calibrate satellite data with public and on-site GNSS sensors. Selecting low-ADI points ensures better correlation between InSAR-derived motion and real-world ground truth.
Determining the Ideal ADI Threshold in UrbanSAR Processing
Choosing the right ADI threshold is crucial and context-dependent:
- Lower thresholds (e.g., 0.4) yield fewer but more stable PS points
- Higher thresholds (e.g., 0.8) include more points but increase noise
In UrbanSAR processing, this threshold is selected empirically, based on validation with ground truth data. The right value depends on radar type, terrain complexity, and project goals.
UrbanSAR Error Estimation Process
Before diving into how ADI thresholds impact displacement measurements, it's helpful to understand the two main (complementary) modes of UrbanSAR processing used to estimate errors:
KorrAI uses two complementary approaches to quantify error in displacement products:
- Single ADI Run
- Multi ADI Run
Single ADI Run (Standard UrbanSAR Workflow)
What happens
- UrbanSAR is run with a fixed ADI threshold (e.g., 0.4 or 0.5).
- PS points are filtered using this ADI value.
- Grid cells of 250 meter are created, each containing a subset of PS points.
Outputs per grid cell
- Mean Displacement: Average of PS point displacements.
- Standard Deviation (Error Bar): Reflects within-cell variability among PS points—this is the primary uncertainty estimate for that run.
Single ADI Run is useful for understanding internal consistency in one deterministic run.
Multi ADI Run (Sensitivity Analysis for Error Quantification)
What happens
- UrbanSAR is run multiple times over the same AOI using different ADI thresholds (typically 0.4–0.8 in 0.1 steps).
- Each run outputs displacement data from a different set of PS points.
- All PS points across these runs are aggregated into the same 250-meter grid cells.
Outputs per grid cell
- Mean Displacement: Average of all PS points from all runs in a given cell.
- Standard Deviation (Error Bar): Measures across-run variability—i.e., how sensitive the displacement value is to the ADI threshold selection.
Multi ADI Run is useful for quantifying robustness of displacement measurements across different filtering levels.
Interpreting the Results
Figures produced in this workflow highlight three key insights:
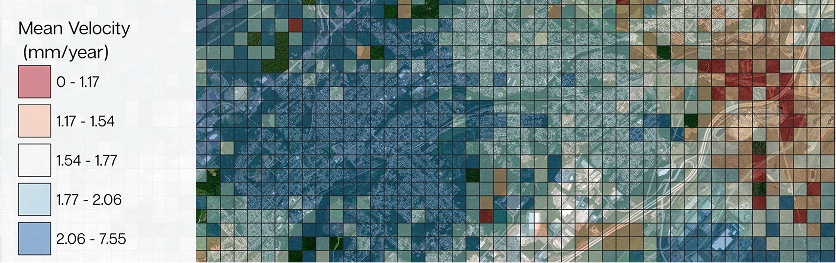
Grid Map
Visualizes average motion and velocity across the study area.
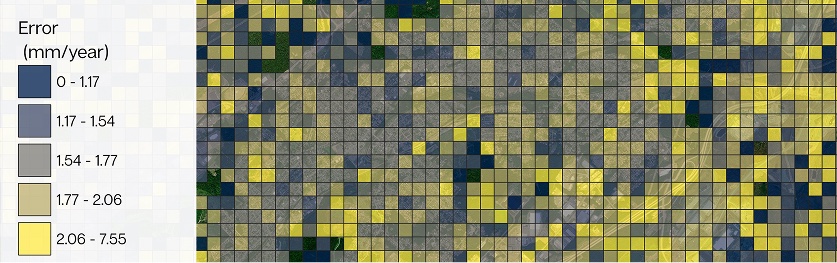
Error Zones
Highlights high-variability areas that might require ground truthing or closer inspection.
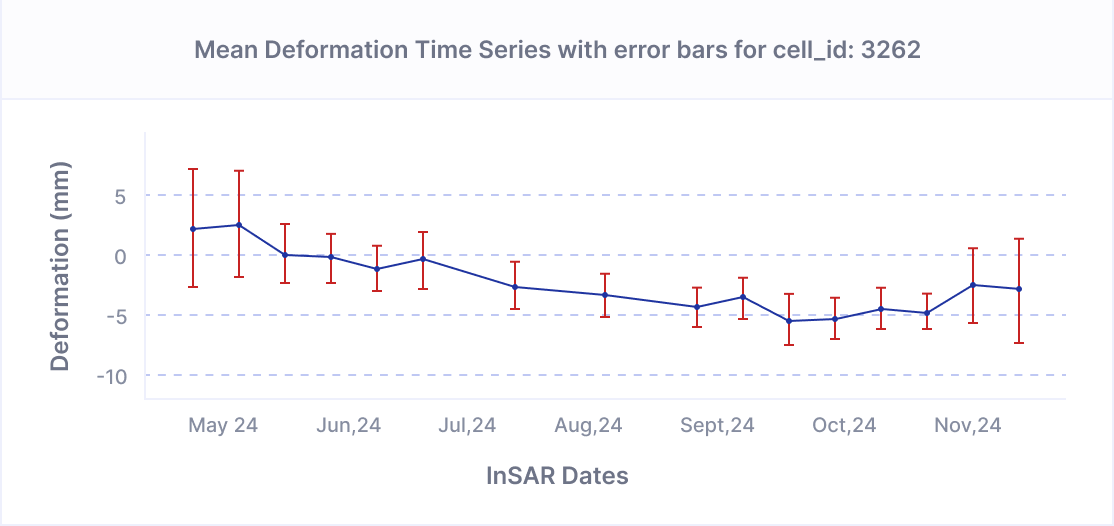
Time Series Plots
For each grid cell, shows average deformation over time with error bars (standard deviation). Larger error bars signal less reliable data.
Final Thoughts
By offering both intra-run and inter-run error estimation, we ensures a high degree of transparency and confidence in our UrbanSAR products. Whether you're a geotechnical engineer, insurance underwriter, or infrastructure manager, understanding the reliability of ground movement data is crucial—and we make that possible.
We hope this empowers you to make more confident, data-driven decisions in choosing the right InSAR provider, reading data, and making interpretations.
Share this post
Written By


Ritwek Khosla
Senior Remote Sensing Scientist
Ritwek has a Bachelor of Engineering (B.E.) in Electronics and Communication Engineering. He started off in Computer Vision before discovering his passion for remote sensing and geospatial data science. Under hobbies and interests, he mentions 'all things geospatial and automation'. Talk about dedication to one's craft!
Written By

Team KorrAI


We send the occasional email with updates, our latest blogs, and our favorite reads on InSAR and the slow moving landscape of ground subsidence.
Subscribe To Our Newsletter
Read by top professionals at


Thank you! Your submission has been received!
Oops! Something went wrong while submitting the form.
.png)
KorrAI identifies threats to critical infrastructure from ground movement using InSAR data from satellites and on-ground sensor networks.


Copyright
.svg)
2025 KorrAI